01 - Growth’s Systemic Paradox

Core business functions follow defined standards. Except growth.
GAAP accounting standards govern reported revenue. GAAP does not provide a view of the opposing movements that form net growth.
02 - The Paradox Extended
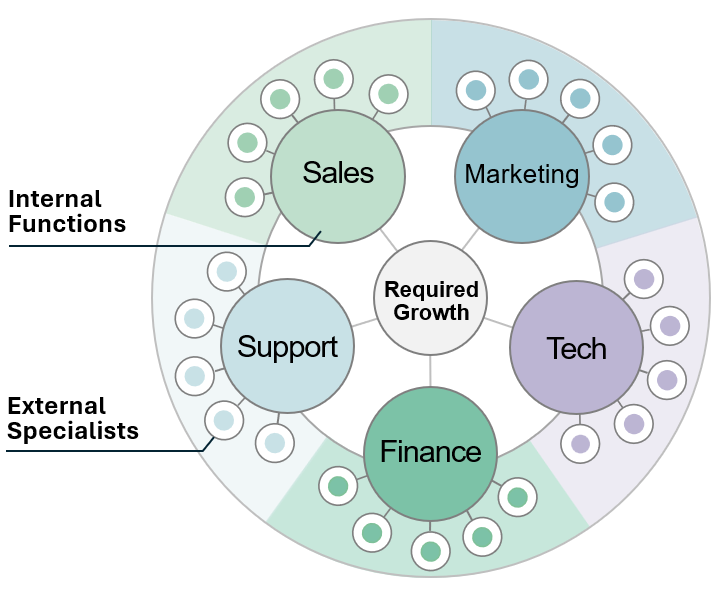
Businesses rely on internal functions and outside specialists to produce growth.
Each discipline measures what matters to its work, with outside specialists adding depth. That knowledge helps each function advance, but the measures never come together to reveal how growth forms across the enterprise.
03 - A Break in the Paradox
Gain growth visibility.
Keep Finance in control.
Finance expects a return on growth investment. Revenue Services Providers (Providers) need a whole-business view to guide their work and assess revenue results.
That whole-business view is now available through a defined, limited revenue extract. Finance checks the extract and approves its release, retaining control of confidential records.
Sequence:
04 - Enterprise Commercial Math
One 3×4 window.
See which customers drive growth—
and which offset it.
Enterprise Commercial Math (ECM) is a revenue-measurement standard. ECM turns the approved revenue data into one consistent, auditable view of customer revenue gains and declines.
Three revenue tiers and four movement states reveal how those movements combine across the whole customer base. The same measurement rules apply to every business. Providers bring their expertise to the questions that emerge.
See for yourself with actual data:
05 - The ECM Relative Performance Index
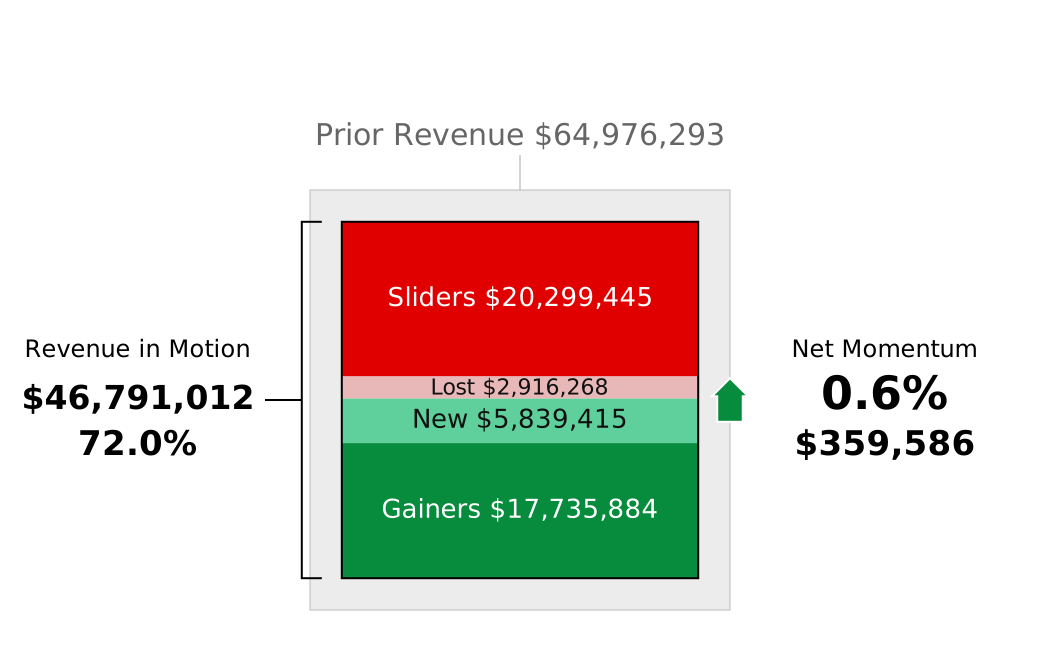
72.0% revenue in motion.
0.6% net growth.
Same company. Declining customer revenue and lost customers created a substantial revenue gap. Revenue from new customers and gains from existing customers had to fill that gap before adding to net growth. The waterfall reveals those opposing movements in that order.
Prior-period reported net revenue: $64,976,293
View the exact reconciliation
| Prior-period revenue | $64,976,293 |
|---|---|
| Current-period revenue | $65,335,879 |
| Net growth: current minus prior | $359,586 |
| Gains: Gainers plus New | $23,575,299 |
| Declines: Sliders plus Lost | $23,215,713 |
| Net growth: gains minus declines | $359,586 |
| Revenue in Motion: gains plus declines | $46,791,012 |
Every dollar value comes from the same reconciled example. Both percentages use prior-period reported net revenue; percentages are rounded.
The ECM Index
The ECM Index compresses the detail of opposing revenue movements and their net result into one board-ready view. Its proportionate arrow shows the direction and size of net growth relative to prior revenue, making outcomes easy to compare. Repeated within a business and across markets, the ECM Index reveals whether substantial gains repeatedly offset substantial erosion.
Select the Index to enlarge it.
ECM Relative Performance Index
Net growth alone leaves those opposing movements unexplained. ECM makes them visible, giving Providers and clients a concrete basis for investigation and planning.
Start with your own assessment06 - Across Industries
A wider view brings more to each client.
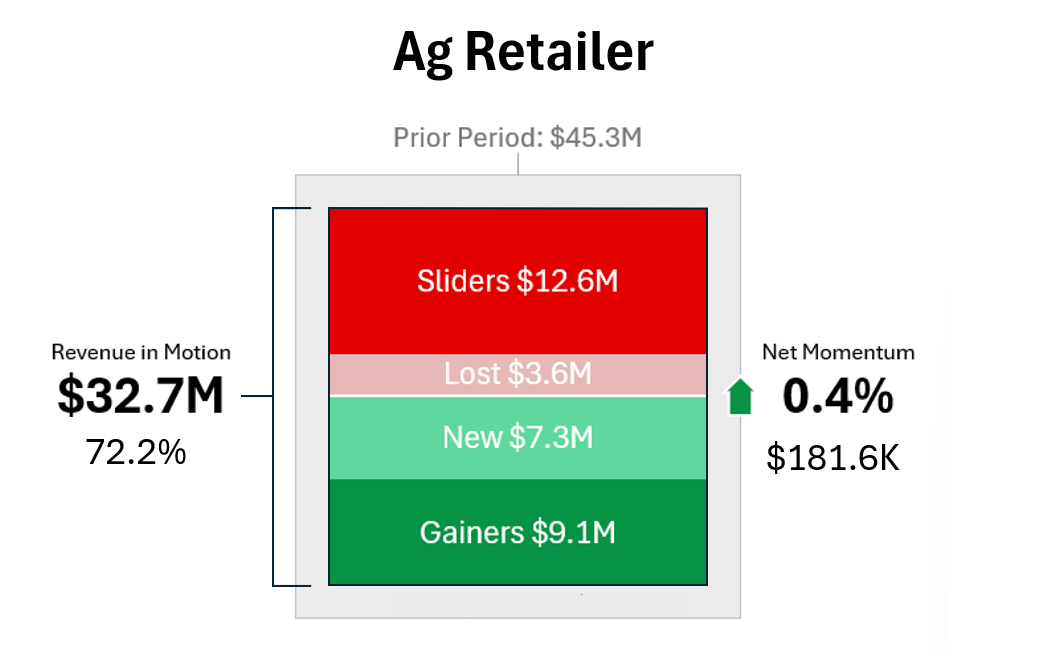
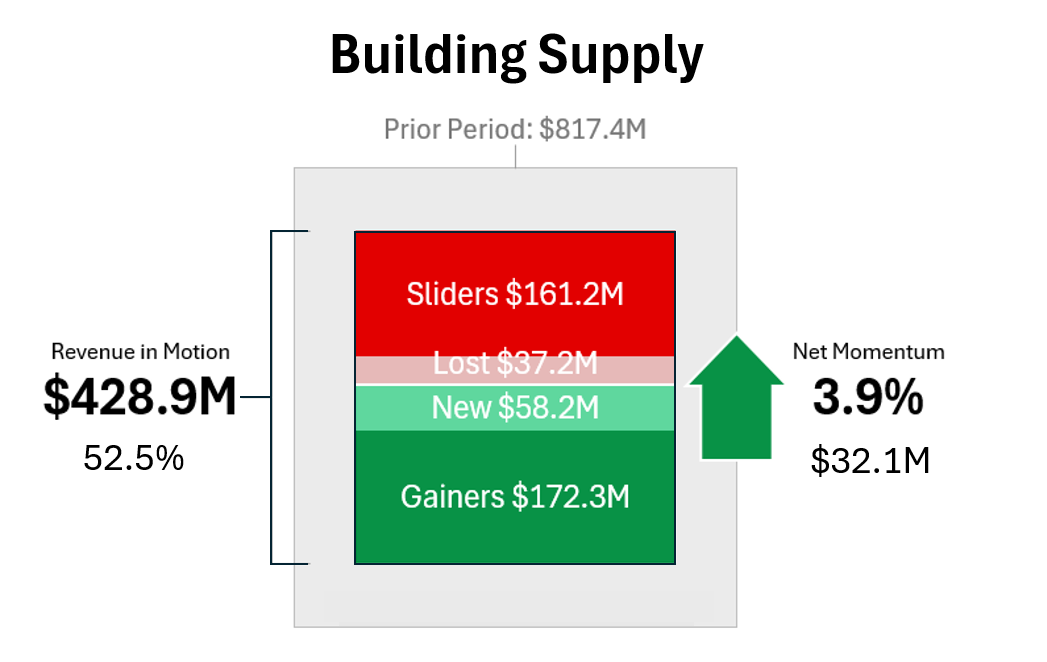
The businesses below differ in size, industry and reported growth. The same ECM Index makes their underlying revenue movements visible, giving Providers a consistent basis for comparison.
Select an Index to enlarge it.
Agricultural Retail
Building Supply
Professional Services
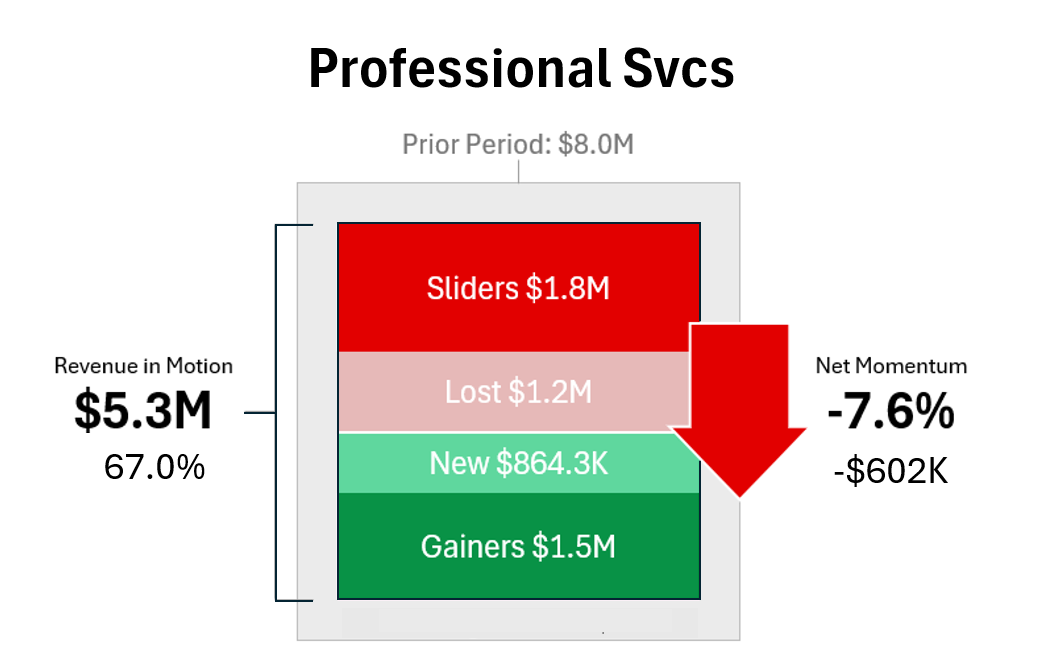
Industrial Products
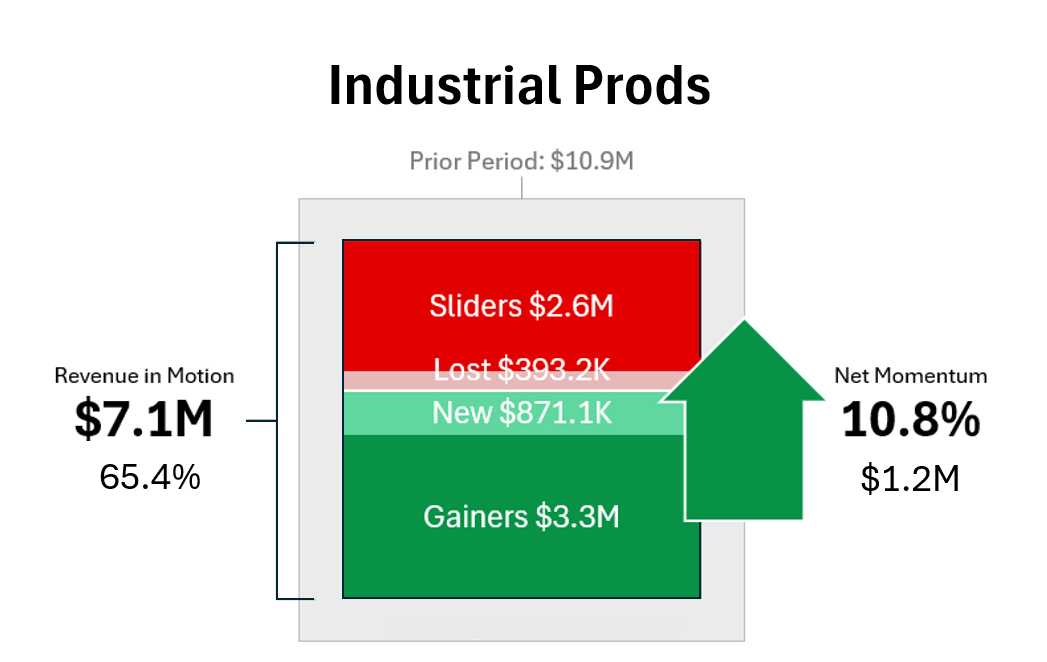
Different businesses. Different results. One consistent measure makes their revenue movements comparable—and gives Providers a basis for recognizing patterns.
07 - Insight That Accumulates
Each application gives the next more context.
The same 3×4 lens extends into business units, product mix, sales geographies and market segments. Each application adds experience in recognizing how growth forms.
Specialists in strategy, sales training, technology, information and messaging all apply the same ECM Standard. ECM Standard stewardship preserves a consistent measure across their work. They bring different expertise to the revenue movements it reveals.
Providers can carry that accumulated understanding into each client engagement. With client authorization and approved aggregation, learning can also extend across Provider firms.
Starting with your own business begins that learning. Each subsequent assessment gives you another opportunity to test and deepen it.
08 - Your Firm’s ECM Assessment
See ECM in your own business first.
See the movement behind your reported growth and experience the Finance-controlled process you would bring to clients.
Start with the capture tool. Your Finance team prepares the limited revenue extract, resolves its checks and approves the file for release. ECMath.org returns your Relative Performance Index, waterfall and 3×4 views at no cost.
Then decide whether to undertake ECM Standard stewardship. Commit to preserving the model, and receive the assessment engine for your own authorized client work.